The Space section under Analytics module in OneLens360 provides a view to the space and capacity utilisation of the spaces configured within the IBSS Platform. The Working Hour Periods and Office Hour Periods calculations are based on building parameters.
Period of interest that is used for utilisation calculations is the building working time that is set with two building parameters:
- Occ_Wkng_Hrs_Stt (start time of the working day)
- Occ_Wkng_Hrs_Stp (end time of the working day)
Overview
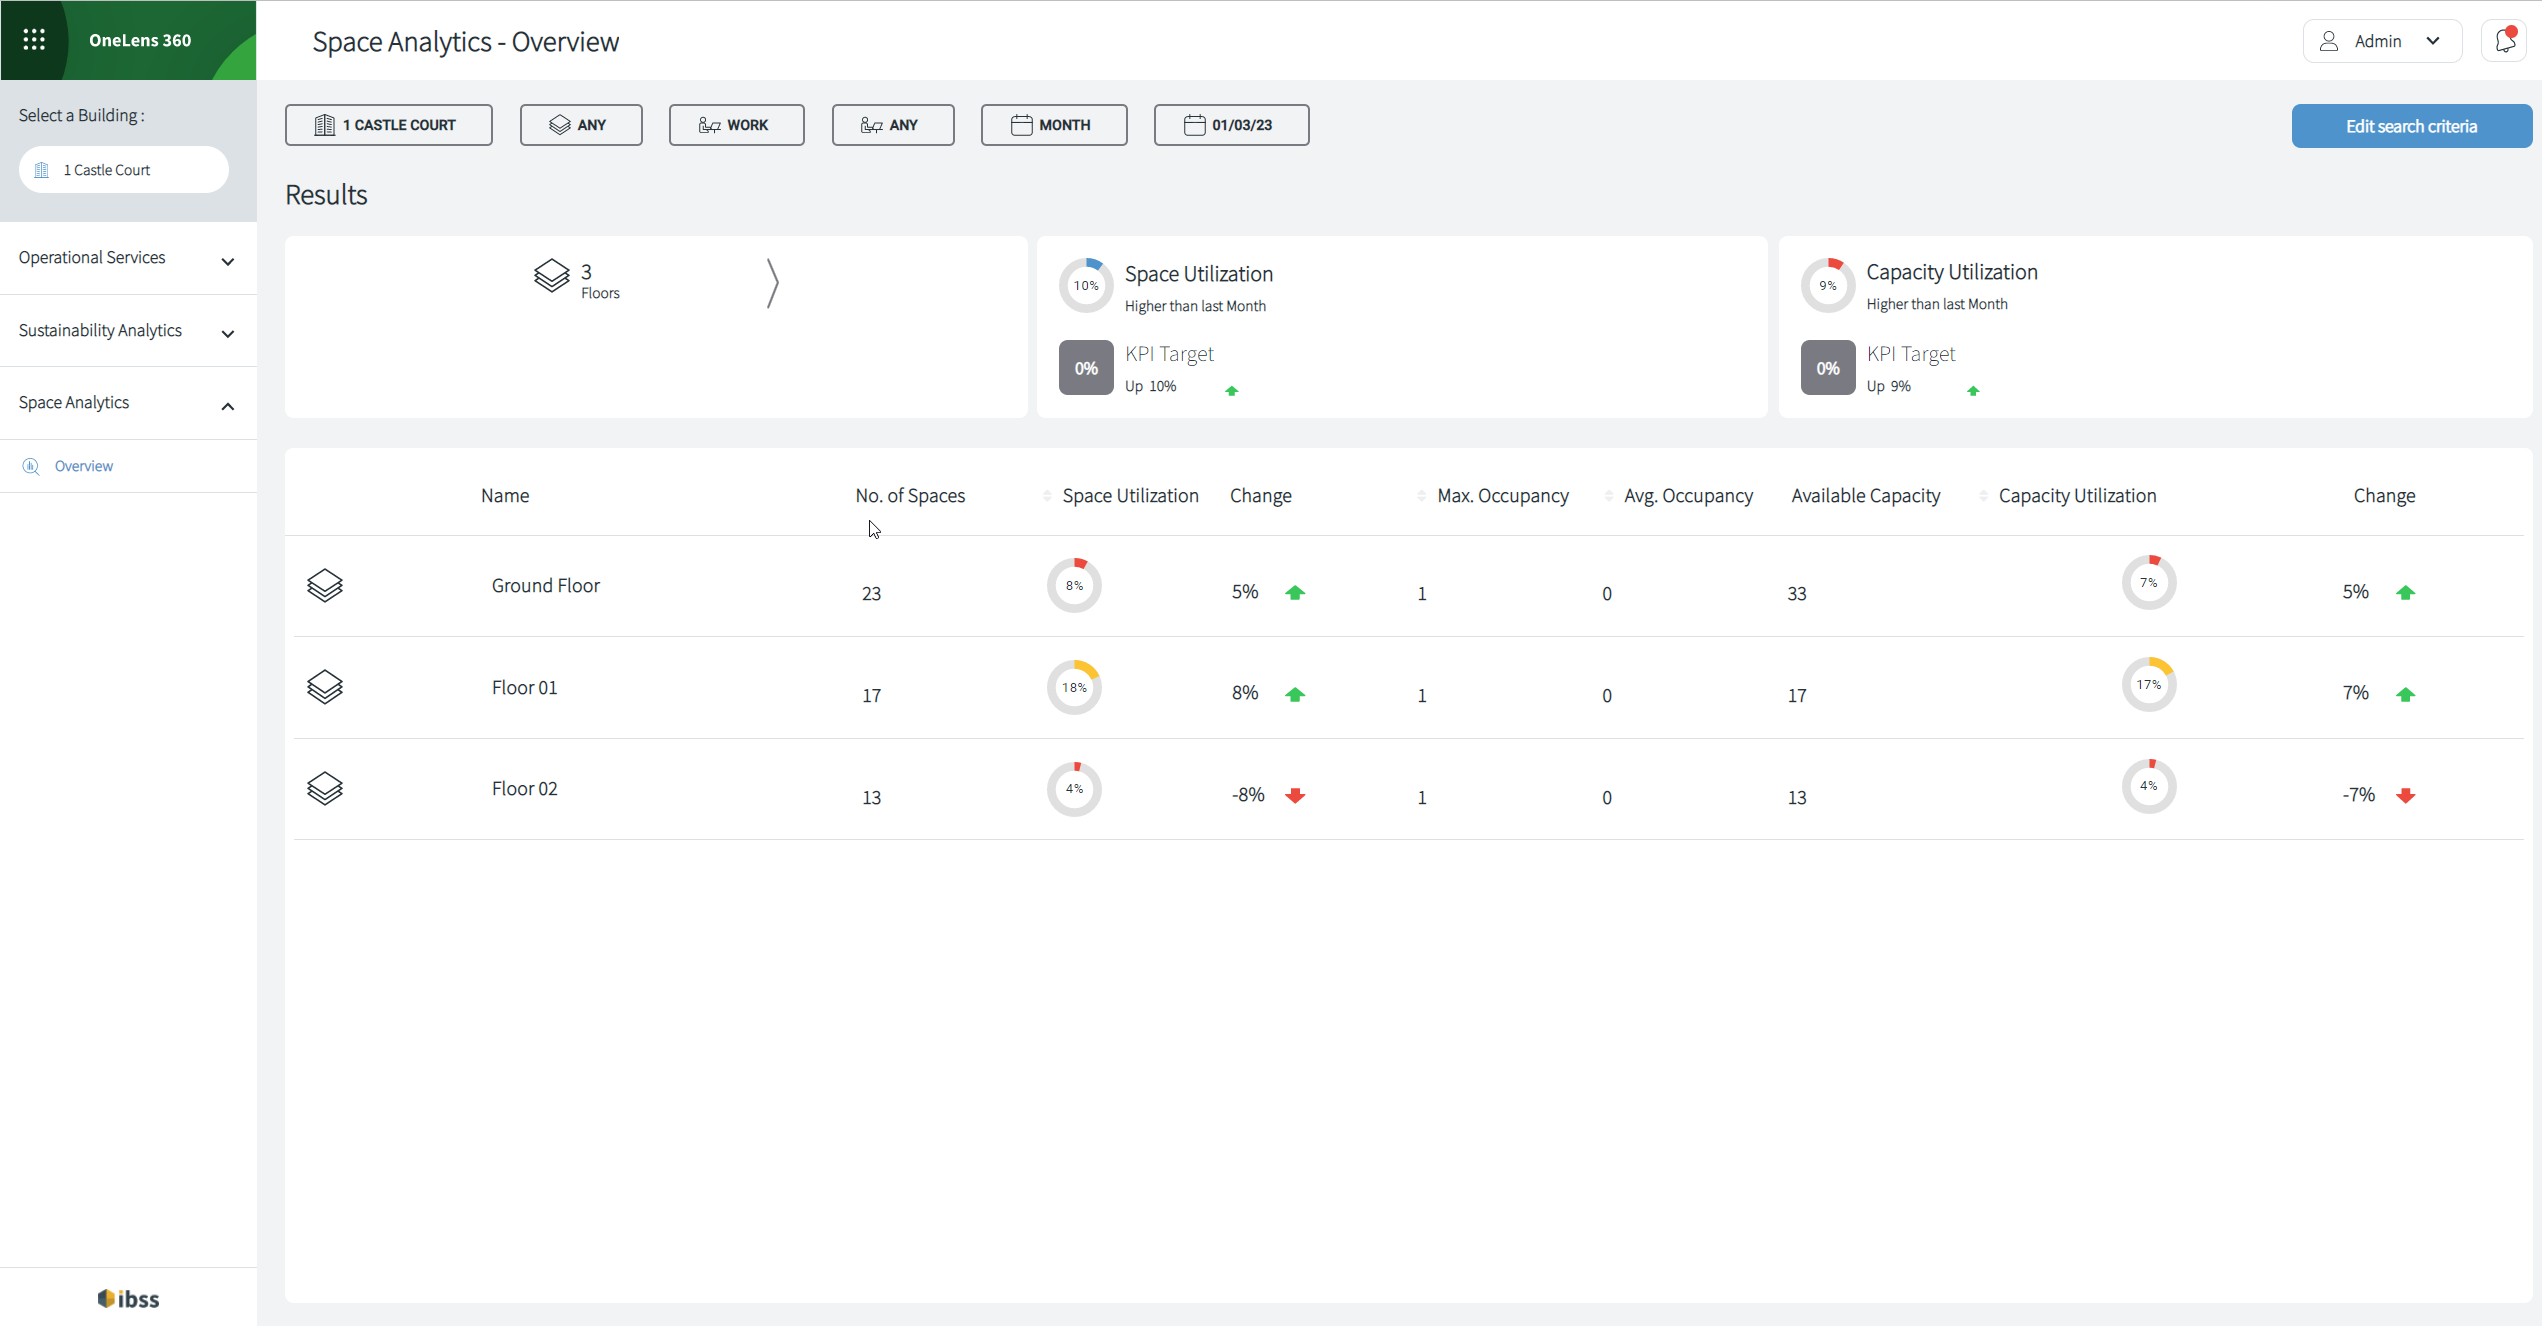
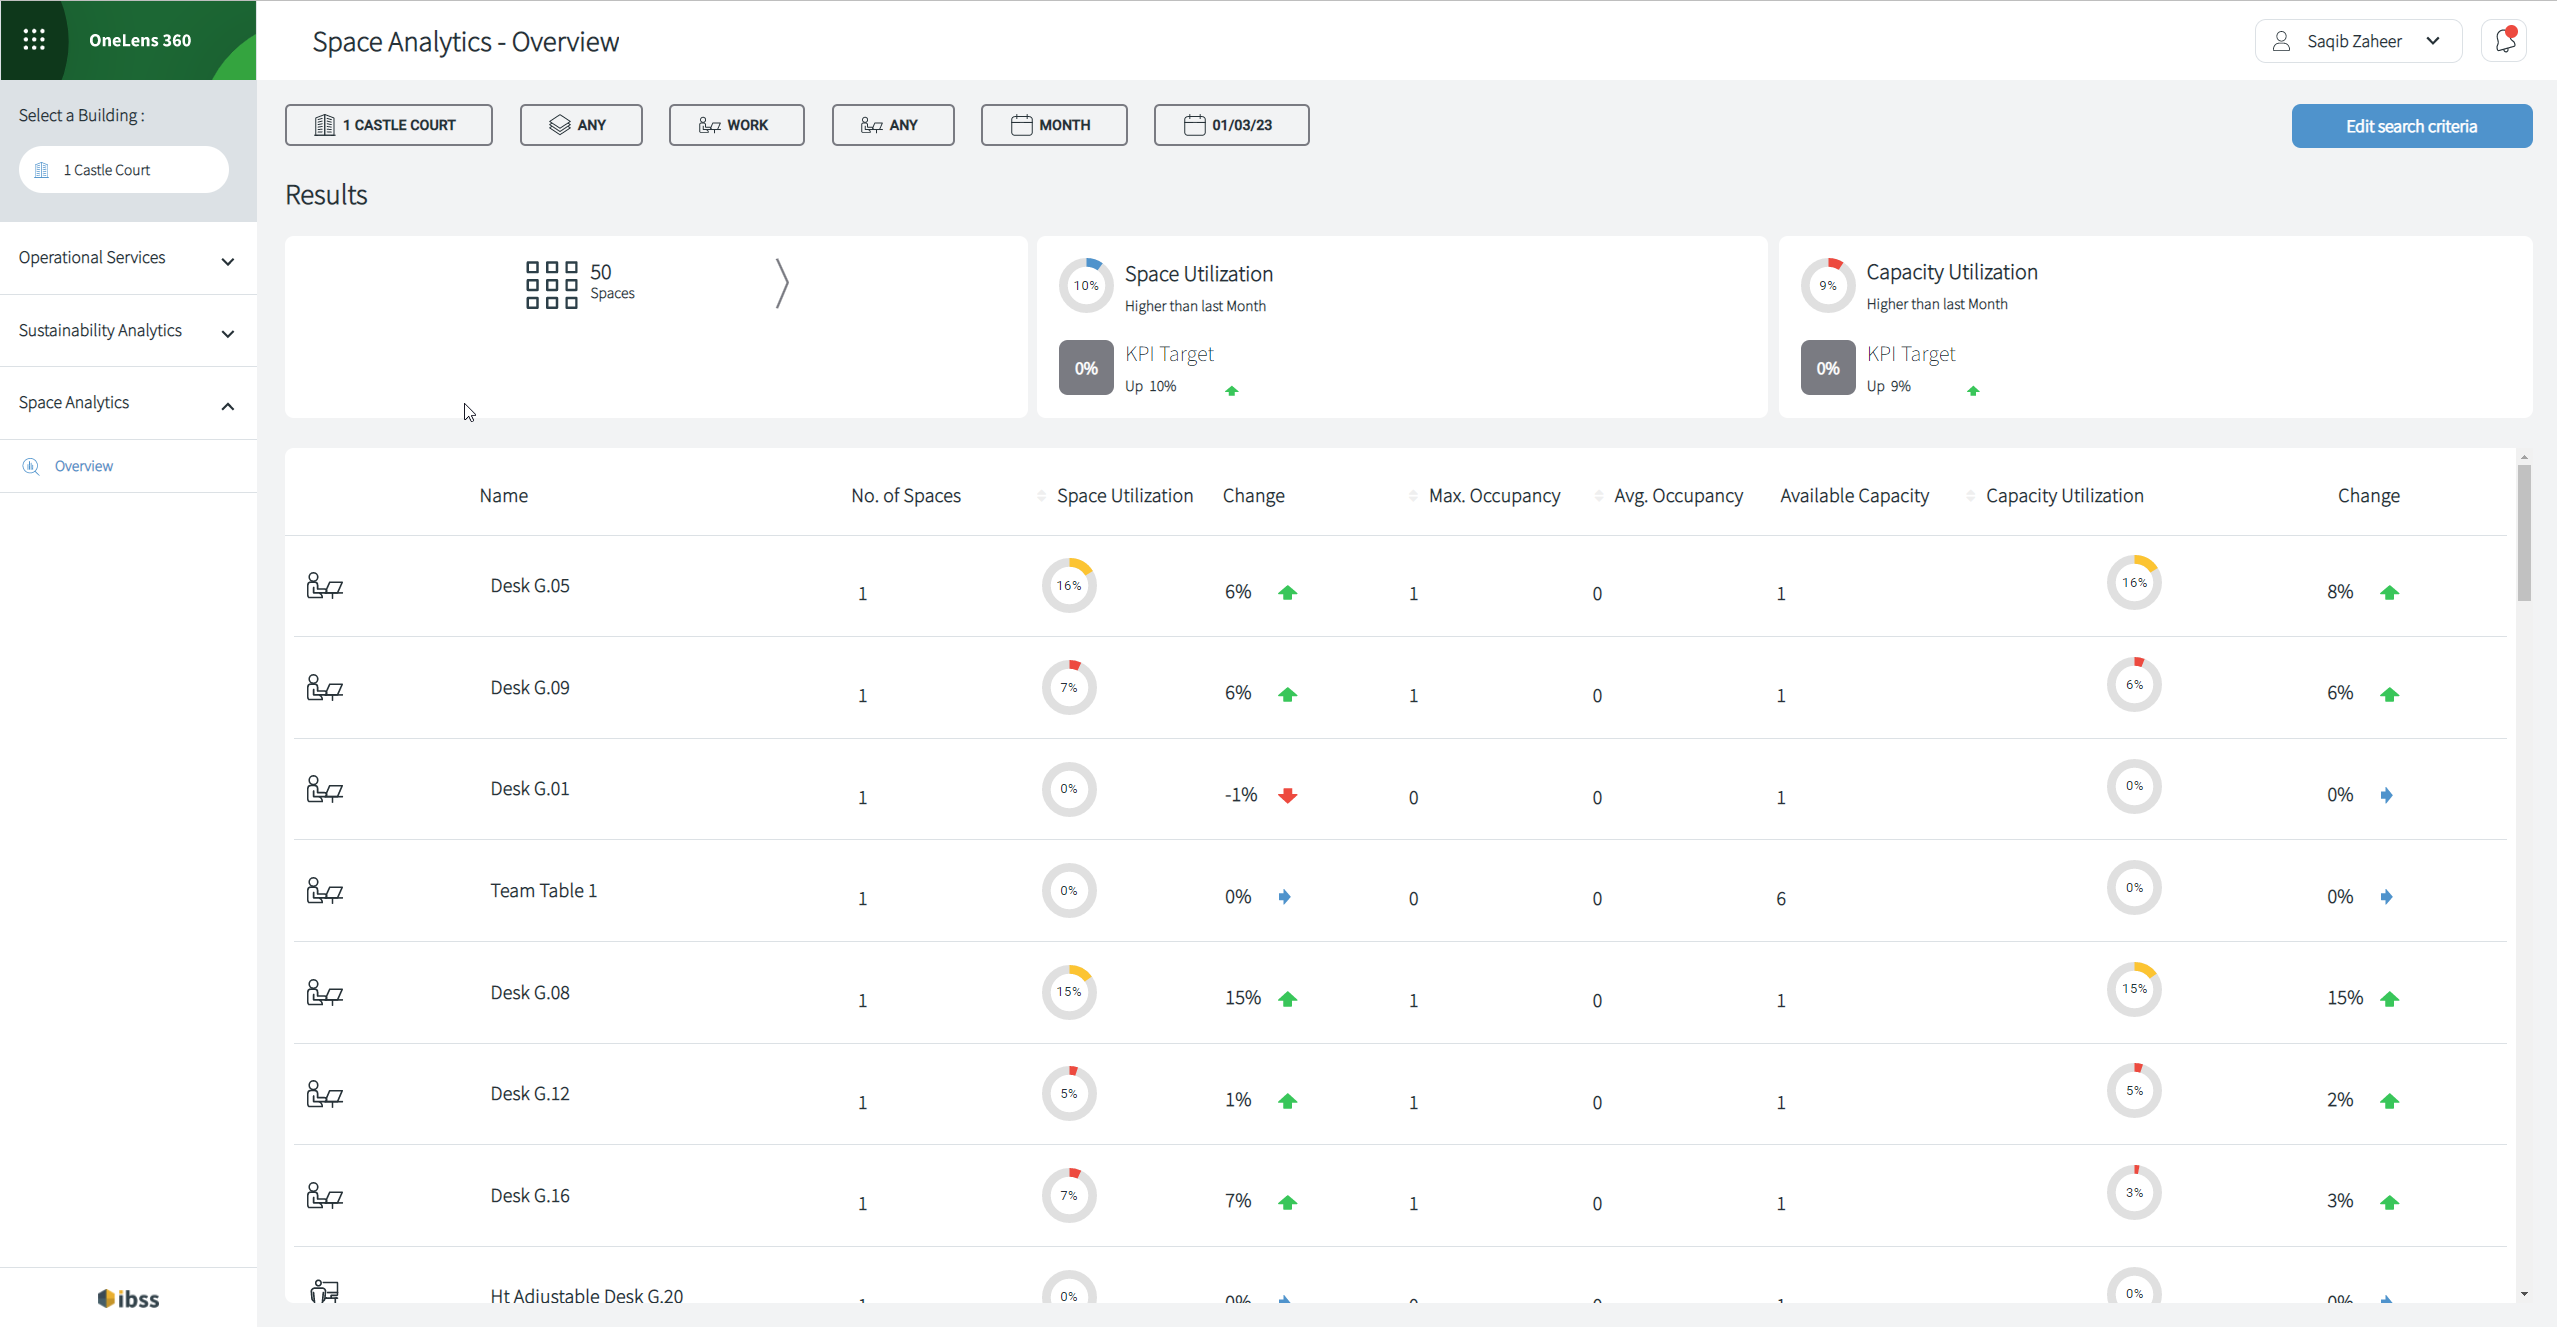
The Overview dashboard offers the space utilisation data in form of charts and a table.
The breadcrumbs along the top of the page denote what filter options are being used to return the data in the results view. By default, the filter options are:
- The currently selected building in the Onelens360 portal
- Any floor (information for all floors)
- Space Class set to Workspaces
- Any Space Types
- The summary period set to a month

- The start of the period set to the first day of the month
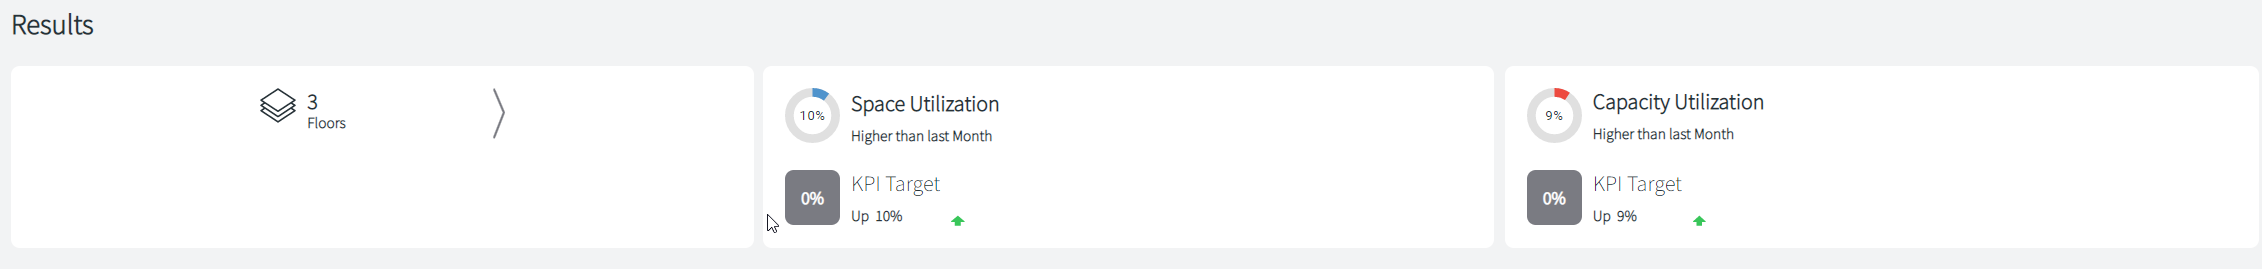
The Results section provides the average Space Utilization and Capacity Utilization values which are then also compared to the Building KPI Target. The percentage change of Space/Capacity Utilization of the selected space from the previous period to the current period is also displayed to provide context.
The table breakdown displays a detailed utilisation overview of the selected space (floor, work type, spaces).
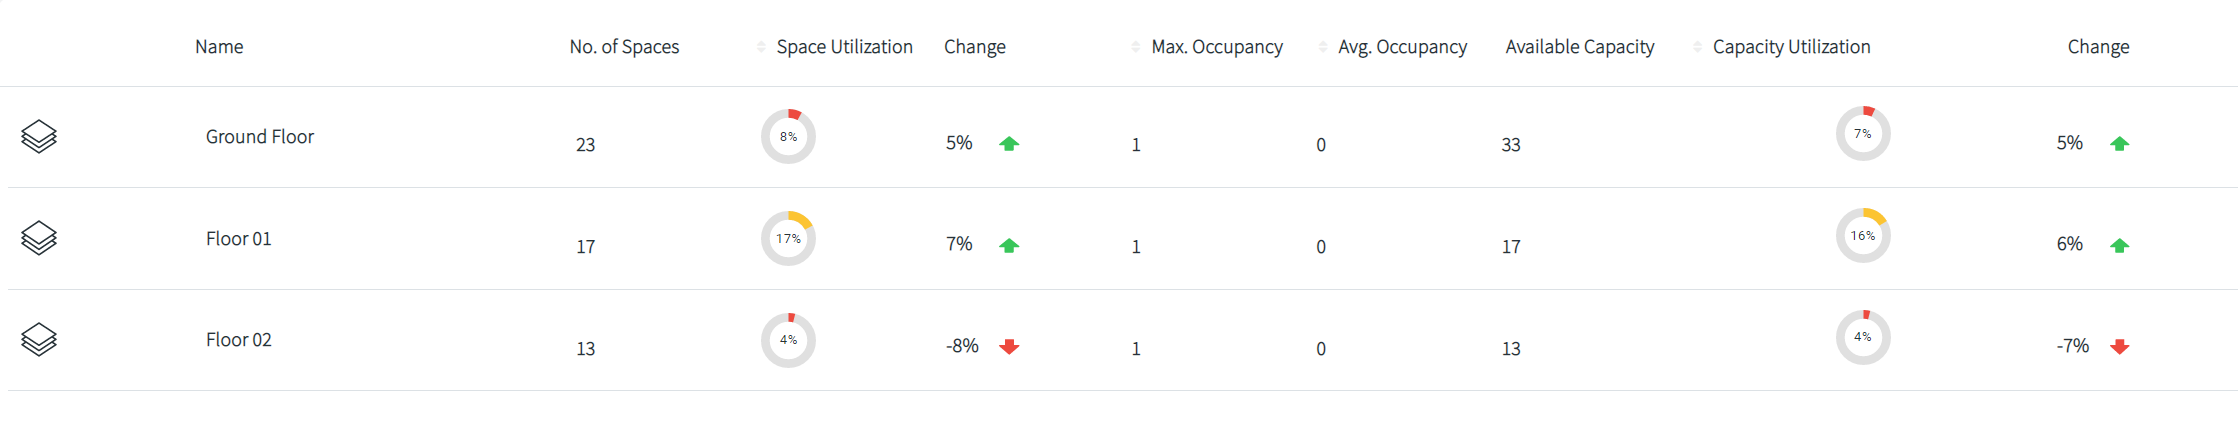
Columns in the table are:
- No. of Spaces: This is the total number of spaces within the given scope (floor, work type, and spaces).
- Space Utilization: The percentage of time that the space was used (occupied, signs-of-life, booked, or reserved) during the time it was available for use. E.g. Desk available for 8 hours a day but only used for 6 hours = 75% space utilisation.
- Change: This is measured by calculating the space utilisation of the scope from the previous period compared to the current period.
-
Max. Occupancy: This is the maximum number of users that were recorded as using the space.
Note: For organisations where occupancy sensors are not used, this will always be 1 for checked-in bookings as we assume the host is always in the meeting. - Avg. Occupancy: This is the average number of users that were recorded as using the space.
- Available Capacity
-
Capacity Utilisation: How well is the space used during the time it was available for use. E.g., 1 person in a 4-person meeting room for the full day = 25% capacity utilisation.
Note: For organisations where occupancy sensors are not used, this will always be 1 for checked-in bookings as we assume the host is always in the meeting. - Change: This is measured by calculating the capacity utilisation of the scope from the previous period compared to the current period.
The search criteria can be changed from the Edit Search Criteria button.
Edit Search Criteria
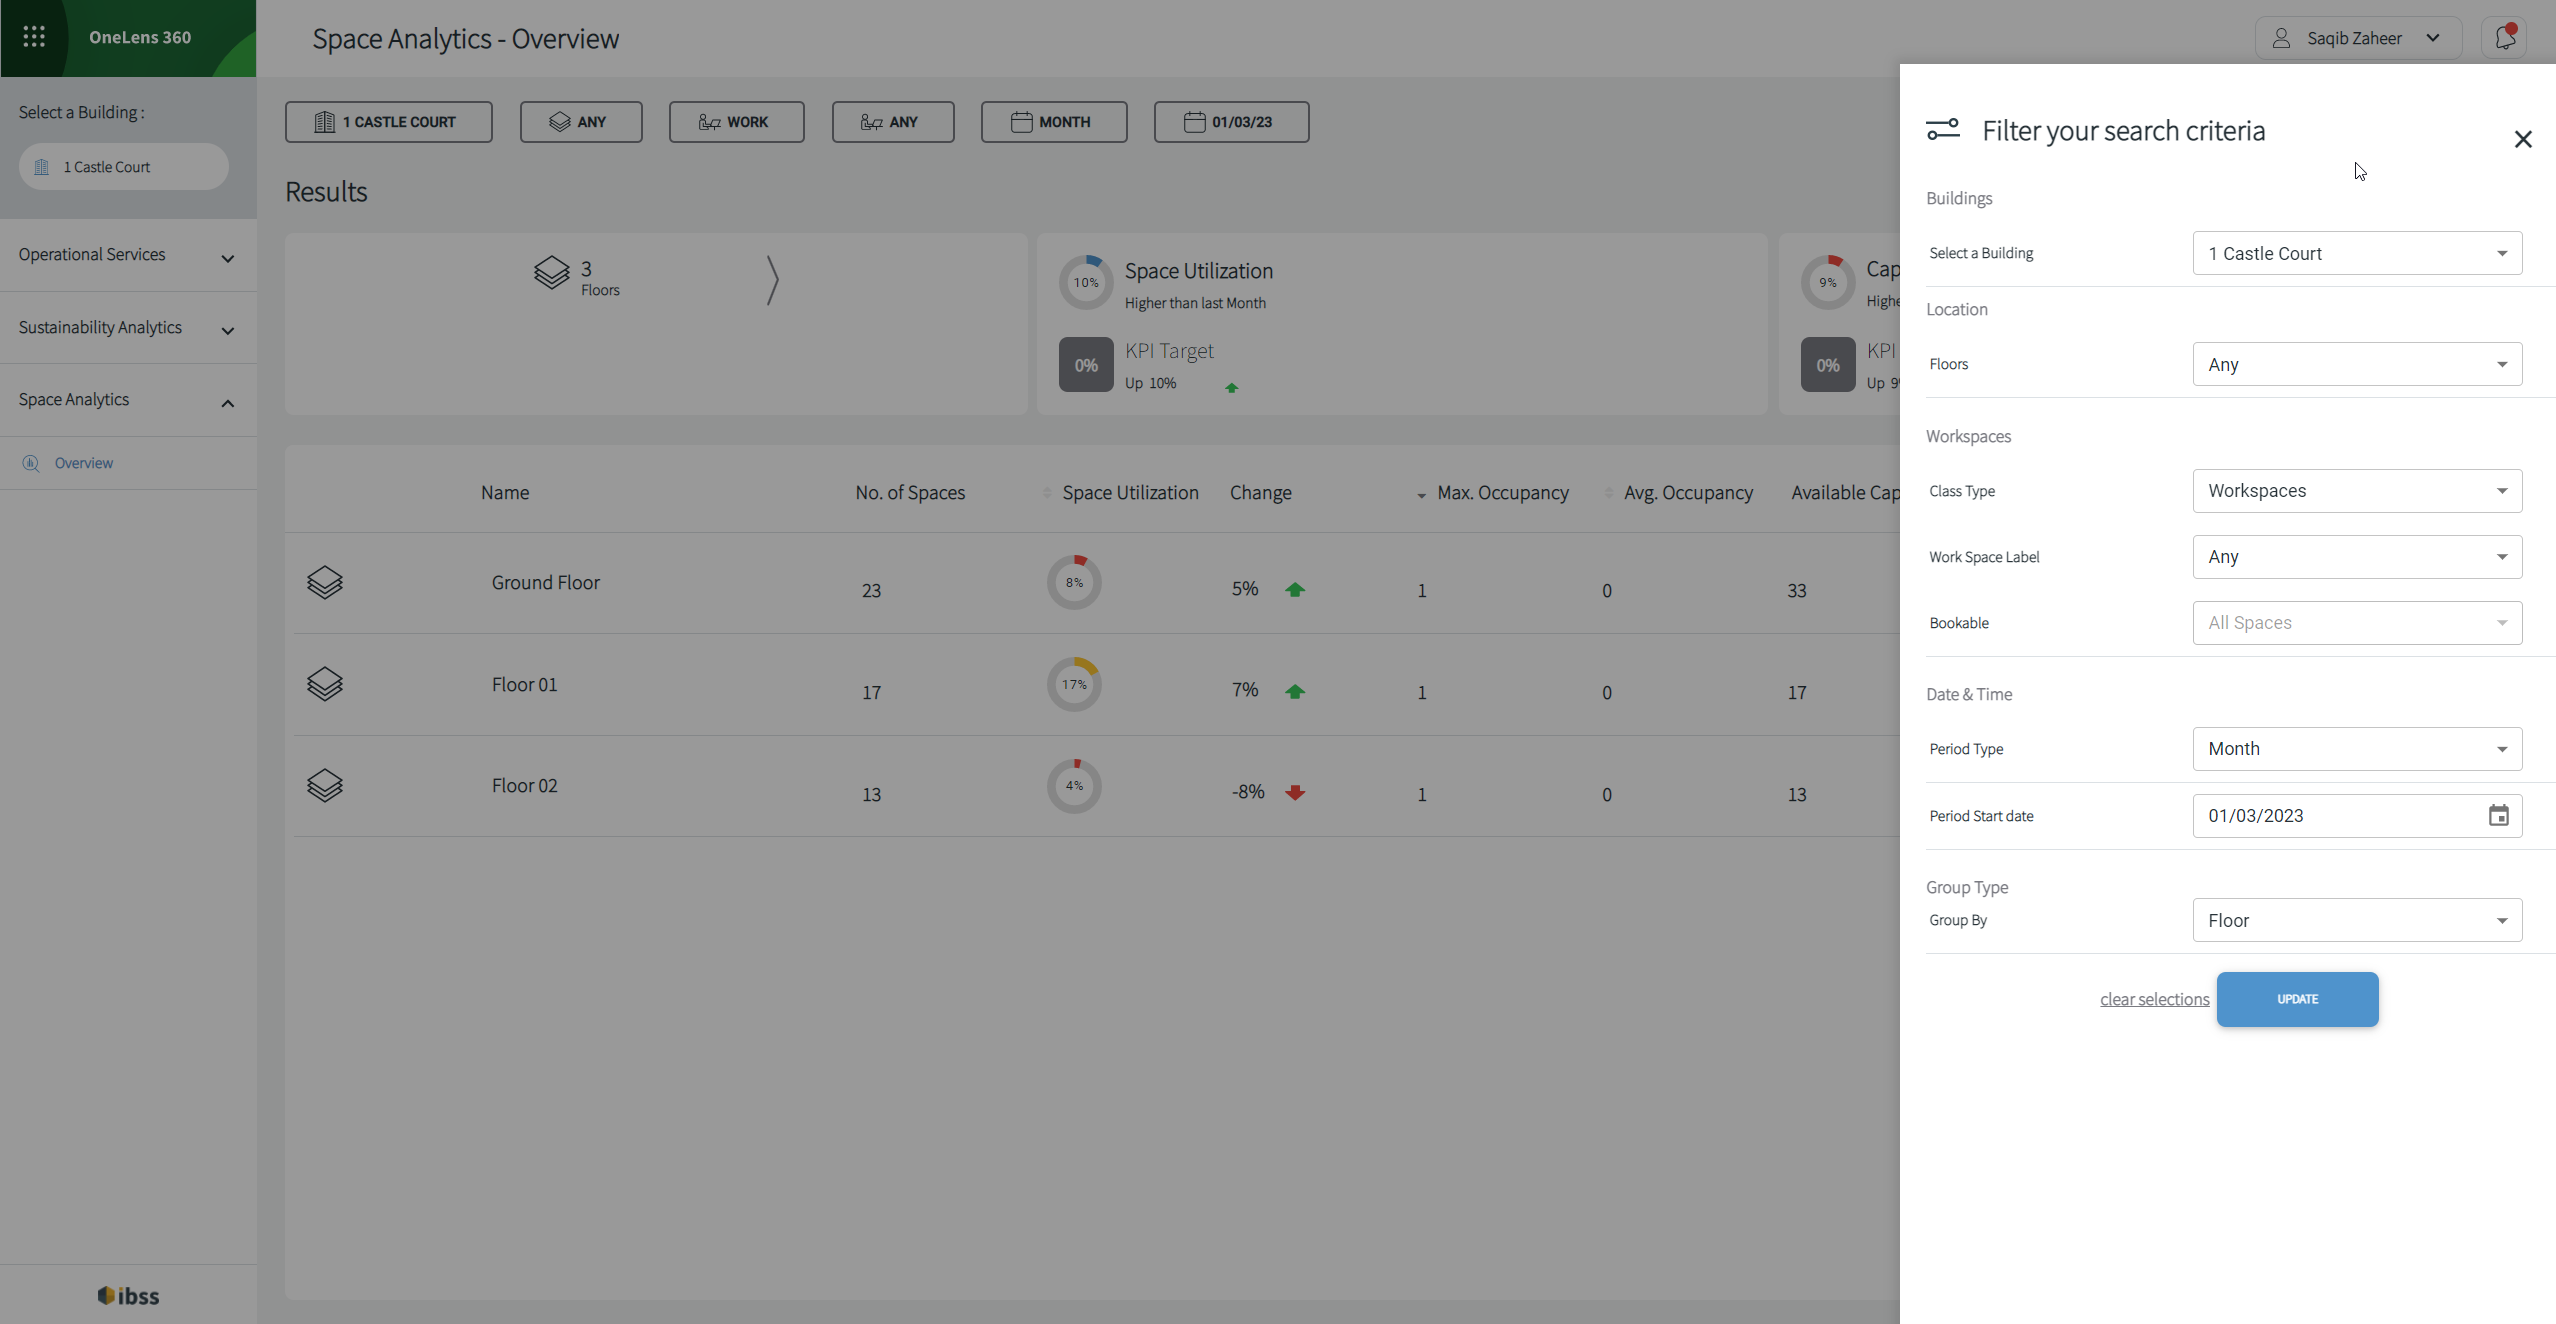
Edit Search Criteria allows you to change the report criteria by:
- Building: You can select any building in your dedicated environment.
- Floors: You can select to view the results of a specific floor or all floors.
- Class Type: You can select whether you want to see the results for Work Spaces, Support Spaces, or Amenities.
-
Workspace Label: You can further select what type of workspace you want to view, for example, desks, sit-stand desks, meeting rooms, water point.
Note that this uses the custom label as defined for your organisation. -
Bookable: You can select to view All Spaces, All Bookable Spaces, All Reservable Spaces, or both All Bookable & Reservable Spaces.
Note: The Bookable field is only filterable when you set the Group By field to Space Name. - Period Type: You can select to view results for specific day, week, month, or year.
- Period Start date
- Group By: You can select to view the results grouped by floor, work type, and space name.
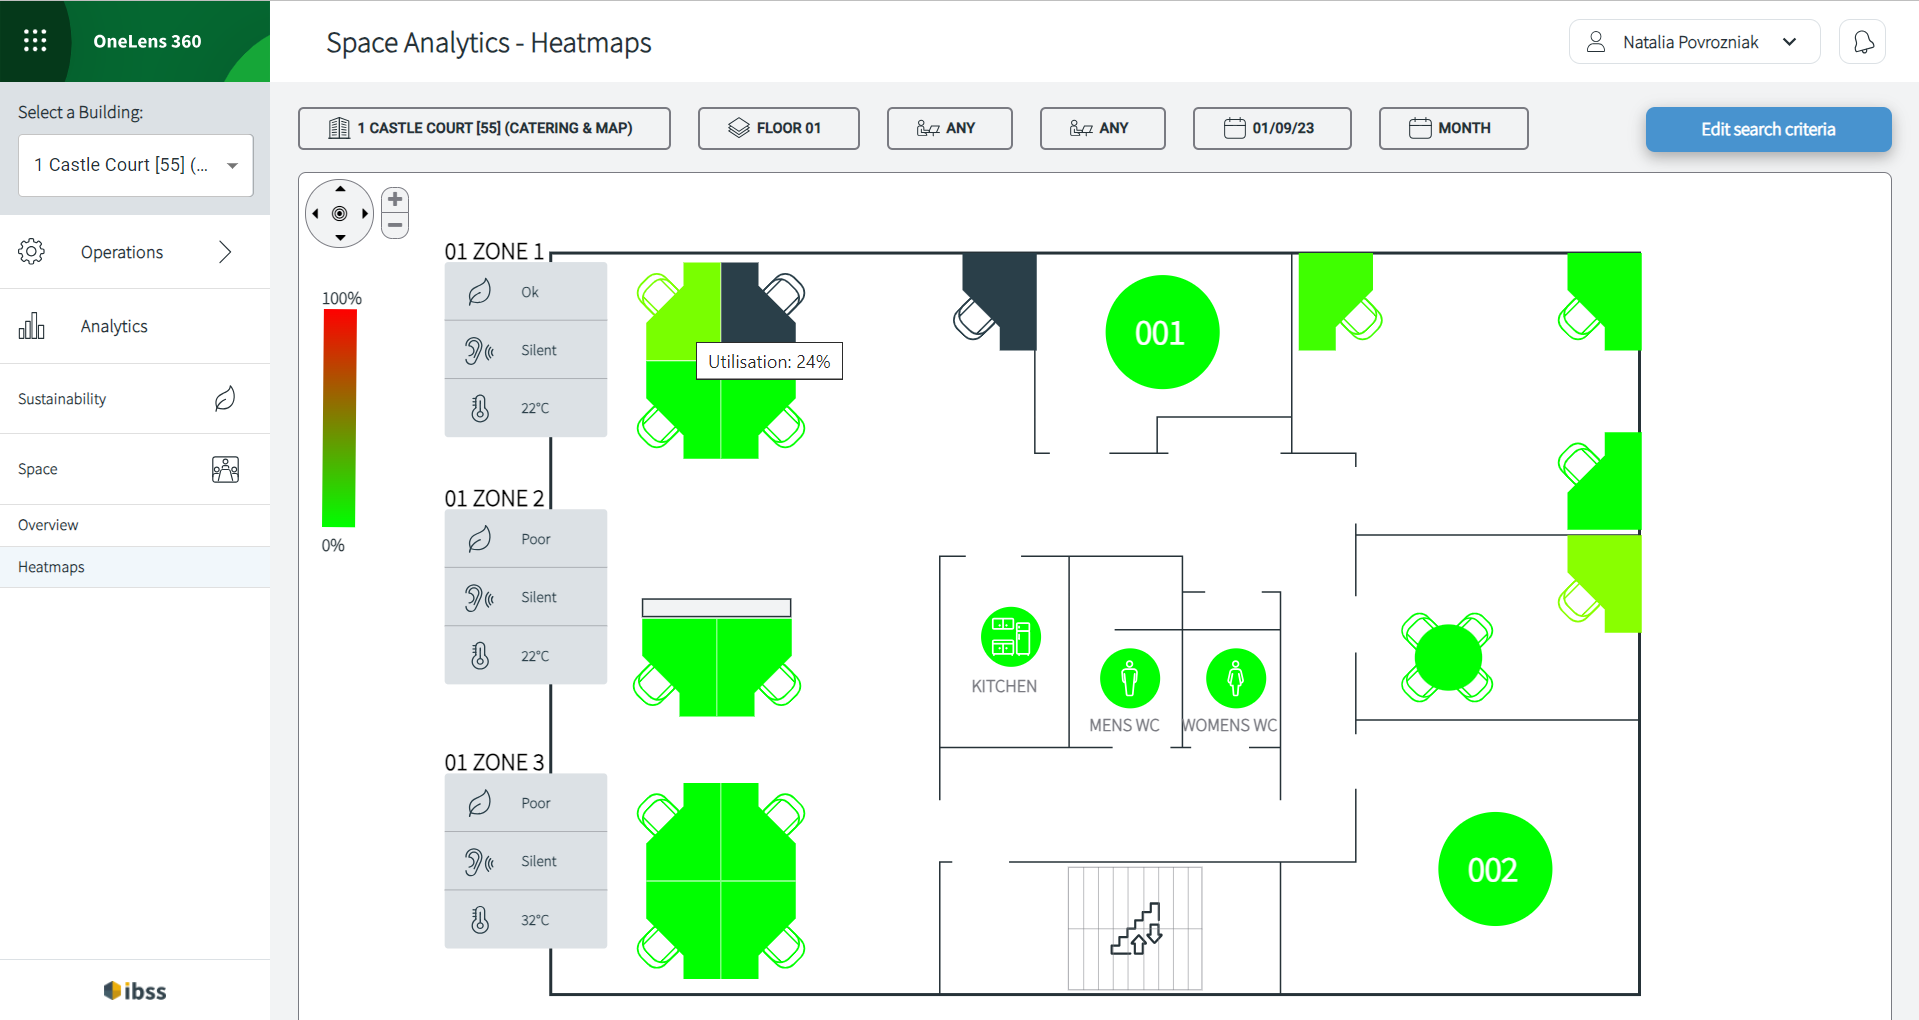
Heatmaps
View utilisation percentage for the spaces on a floor within the selected building. Use Edit search criteria to view spaces on a different floor or for another date range.